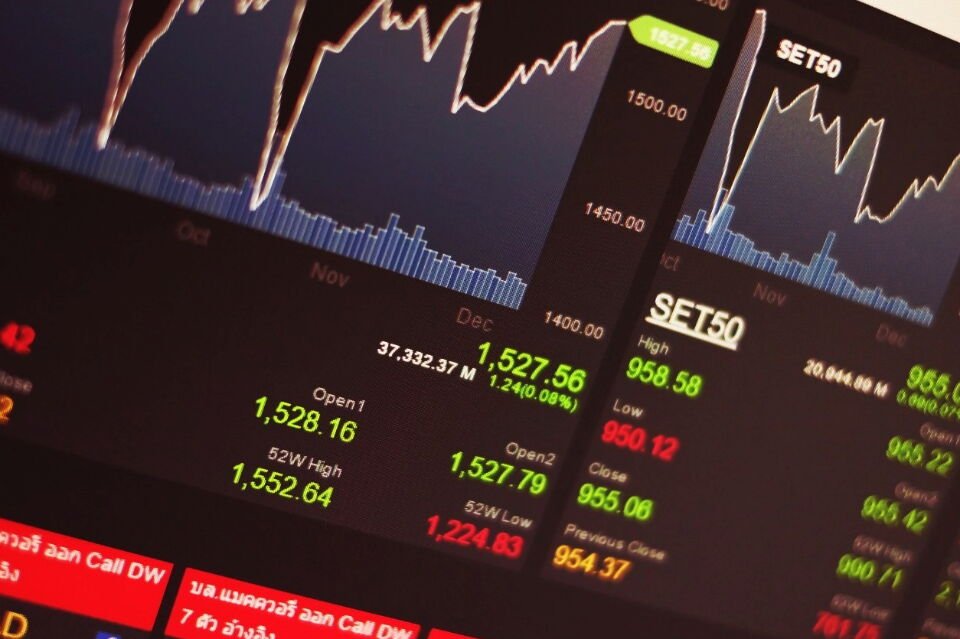
In the fast-paced world of trading, where price fluctuations may happen in an instant, many traders rely on technical analysis to help them make sense of the chaos. Whether it’s stocks, commodities, or currency pairings, technical analysis provides methods for interpreting market data and forecasting future price moves. Traders look for patterns in price charts, historical data, and important indicators to gain a competitive advantage. However, while technical analysis may be quite useful, it is critical to understand its components, how they interact, and the constraints that traders must consider.
What is technical analysis?
Technical analysis is the study of price movements and market data to predict future trends. Unlike fundamental analysis, which looks at a company’s financial health or macroeconomic indicators, technical analysis considers that all available information is represented in the price. It is predicated on the idea that price changes are not random, but rather follow patterns determined by market psychology. Technical analysts think that by examining historical price activity, they may forecast future behavior and influence their trading decisions with a range of instruments.
For example, if a stock price repeatedly bounces off a specific level, known as a support level, traders may anticipate that the price would climb again when it reaches that same level in the future. These insights can help traders establish short-term strategies and make educated judgments, whether they’re day trading or investing for the long run.
Key Components of Technical Analysis:
Technical analysis is comprised of numerous key components that assist traders in assessing market trends. These elements include price patterns, support and resistance levels, volume, and important indicators like as moving averages and the Relative Strength Index (RSI).
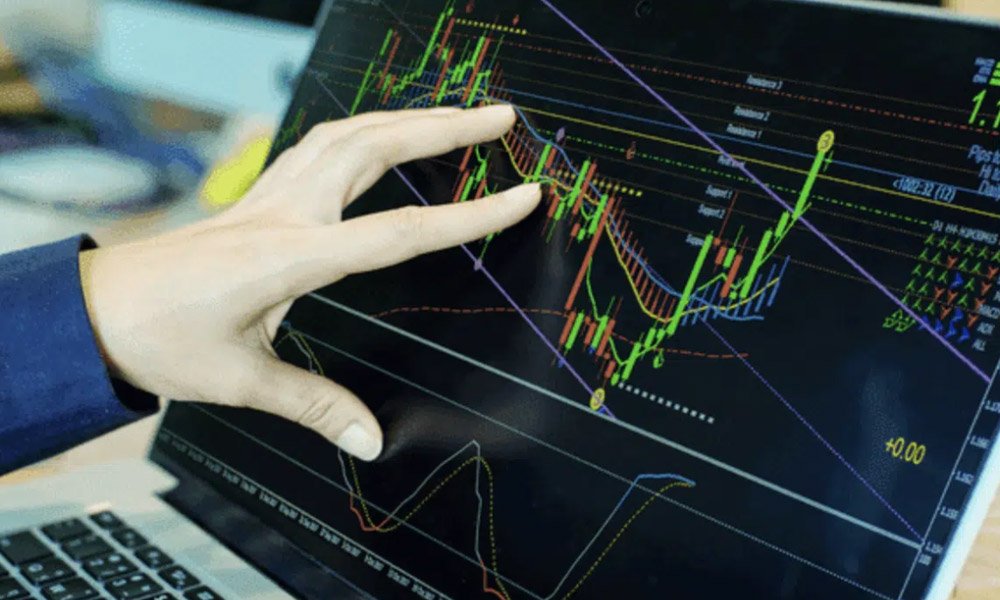
Pricing Patterns and Trends
Price patterns are the basis of technical analysis. Traders frequently use chart patterns like head and shoulders, triangles, and double tops to identify trends. These patterns show whether the market is trending up (bullish) or down (bearish). Recognizing these tendencies early can lead to winning bets.
Support and Resistance
Support and resistance are important ideas in technical analysis. Support is the price level at which an asset is likely to attract purchasing interest, keeping it from dropping further. Resistance, on the other hand, is the point at which selling pressure tends to drive prices down. Identifying these levels allows traders to recognize probable entry and exit positions.
Volume
Volume is another important metric utilized in technical analyses. It displays the amount of shares or contracts exchanged during a specific time period. Volume frequently confirms the strength of a price movement. For example, if a stock is rising and volume is increasing, this might imply a significant upward trend. In contrast, low volume during price changes may indicate a lack of faith in the trend, making price action less dependable.
Popular Technical Indicators
In addition to price patterns, numerous indicators are utilized to give extra information about market circumstances. Moving averages, RSI, and Bollinger bands are some of the most commonly employed.
Moving Averages
Moving averages smooth out price data over a specific time period, making it easier to discern trends. They can be used to validate the direction of a trend or identify potential reversals. For example, when a short-term moving average crosses above a long-term moving average, it may indicate a buy opportunity, whilst the opposite crossing may indicate a sell. Moving averages are frequently used as dynamic support and resistance levels.
The Relative Strength Index (RSI) is a momentum oscillator that tracks the rate and change of price movements. It spans from 0 to 100 and is used to detect overbought or oversold circumstances. An RSI above 70 usually indicates that an asset is overbought and may be ready for a market correction, whilst an RSI below 30 indicates that the asset is oversold and may recover.
Bollinger Bands
Bollinger Bands, which monitor market volatility, are made up of a moving average with two standard deviations shown above and below it. When the bands narrow, it indicates that volatility is minimal, which frequently signals a probable breakout. When the bands broaden, it signals increased volatility, implying that the trend may continue or perhaps reverse.
Technical analysis helps traders identify opportunities
Technical analysis is powerful because it may determine exact entry and exit points. By evaluating important price levels, traders may choose where to join and leave a transaction in order to maximise profits or minimise losses.
For entry opportunities, traders often seek for scenarios in which the price approaches support levels or shows indicators of momentum, such as moving averages crossing or the RSI indicating oversold circumstances. Similarly, exit points are frequently predicated on resistance levels, volume analysis, or indications from indicators like as RSI that suggest overbought circumstances.
Limitations of Technical Analysis
While technical analysis provides several tools and insights, it is not without restrictions. One of the most significant issues is that markets are not always predictable. Economic announcements, political events, and unanticipated global catastrophes can all have a significant impact on prices, making technical analysis less trustworthy in these situations. Furthermore, indicators like moving averages and RSI are trailing indicators, meaning they follow market movement and may flag trends too late for traders to act on them efficiently.
Furthermore, technical analysis is based on historical price data, which believes that previous price behavior will continue in the future. However, market conditions may change quickly, and historical trends may not be applicable in the future. As a result, traders must utilize technical analysis as part of a larger trading strategy that includes other types of analysis, such as fundamental analysis or market sentiment, in order to make better decisions.
Combining technical and fundamental analysis
To overcome the limits of using only technical analysis, many traders combine it with fundamental analysis. This method broadens their understanding of market circumstances by taking into account both price activity and fundamental variables impacting the asset. For example, a trader may use technical analysis to timing their entry and exit points, whereas fundamental analysis is used to examine a company’s health or the economic variables impacting the price.
Risk management measures are very important in this procedure. Stop-loss orders, position management, and a diversified strategy can all assist guard against unexpected market fluctuations that technical analysis may not forecast.
Frequently Asked Questions
What is technical analysis?
Technical analysis involves studying past price movements and market data to predict future price trends using charts, patterns, and indicators.
How does technical analysis help traders?
It helps traders identify entry and exit points by spotting patterns, trends, and key levels like support and resistance.
Are there limitations to technical analysis?
Yes, technical analysis relies on historical data and may not account for unexpected market events or news, making it less reliable in certain conditions.